Intro
I was browsing r/pygame
when I saw this post,
and I was instantly entranced by the curious shapes being created by this visualization.
The creator linked to this demonstration,
and I decided to recreate the image in Python. I usually use pygame, but the creator
used pygame to generate their images. I wanted to try something different, and I've been meaning to learn
pycairo, so I figured this would be the perfect opportunity: I can learn
this graphics library by make a cool-looking math visual.
The Circle
To create a modular multiplication circle, you pick two numbers; let's call them \(mod\) and \(mult\). The circle we create will have \(mod\) number of points. To each point, we just assign each point a number from 0 to \(mod - 1\). For example, if \(mod = 60\), then we number the points from 0 to 59, starting at the top of the circle and going clockwise.
Why did I choose to start numbering at the top of the circle and go clock-wise? There was no particular reason. You can pick to choose to start at any other position around the circle and to go clockwise or counter-clockwise.
So then for each point in the circle (call this the starting point), take the number representing that point, multiply it by \(mult\) and find the remainder when you divide it by \(mod\). Find the point represented by the remainder (the ending point), and connect the two points.
This is the algorithm for creating the visualization. Choosing a different number of points and varying the multiplier can make chaotic patterns or more beautiful patterns. If you vary the color of the lines based on which point you're on, you can get a nice color palette, too.
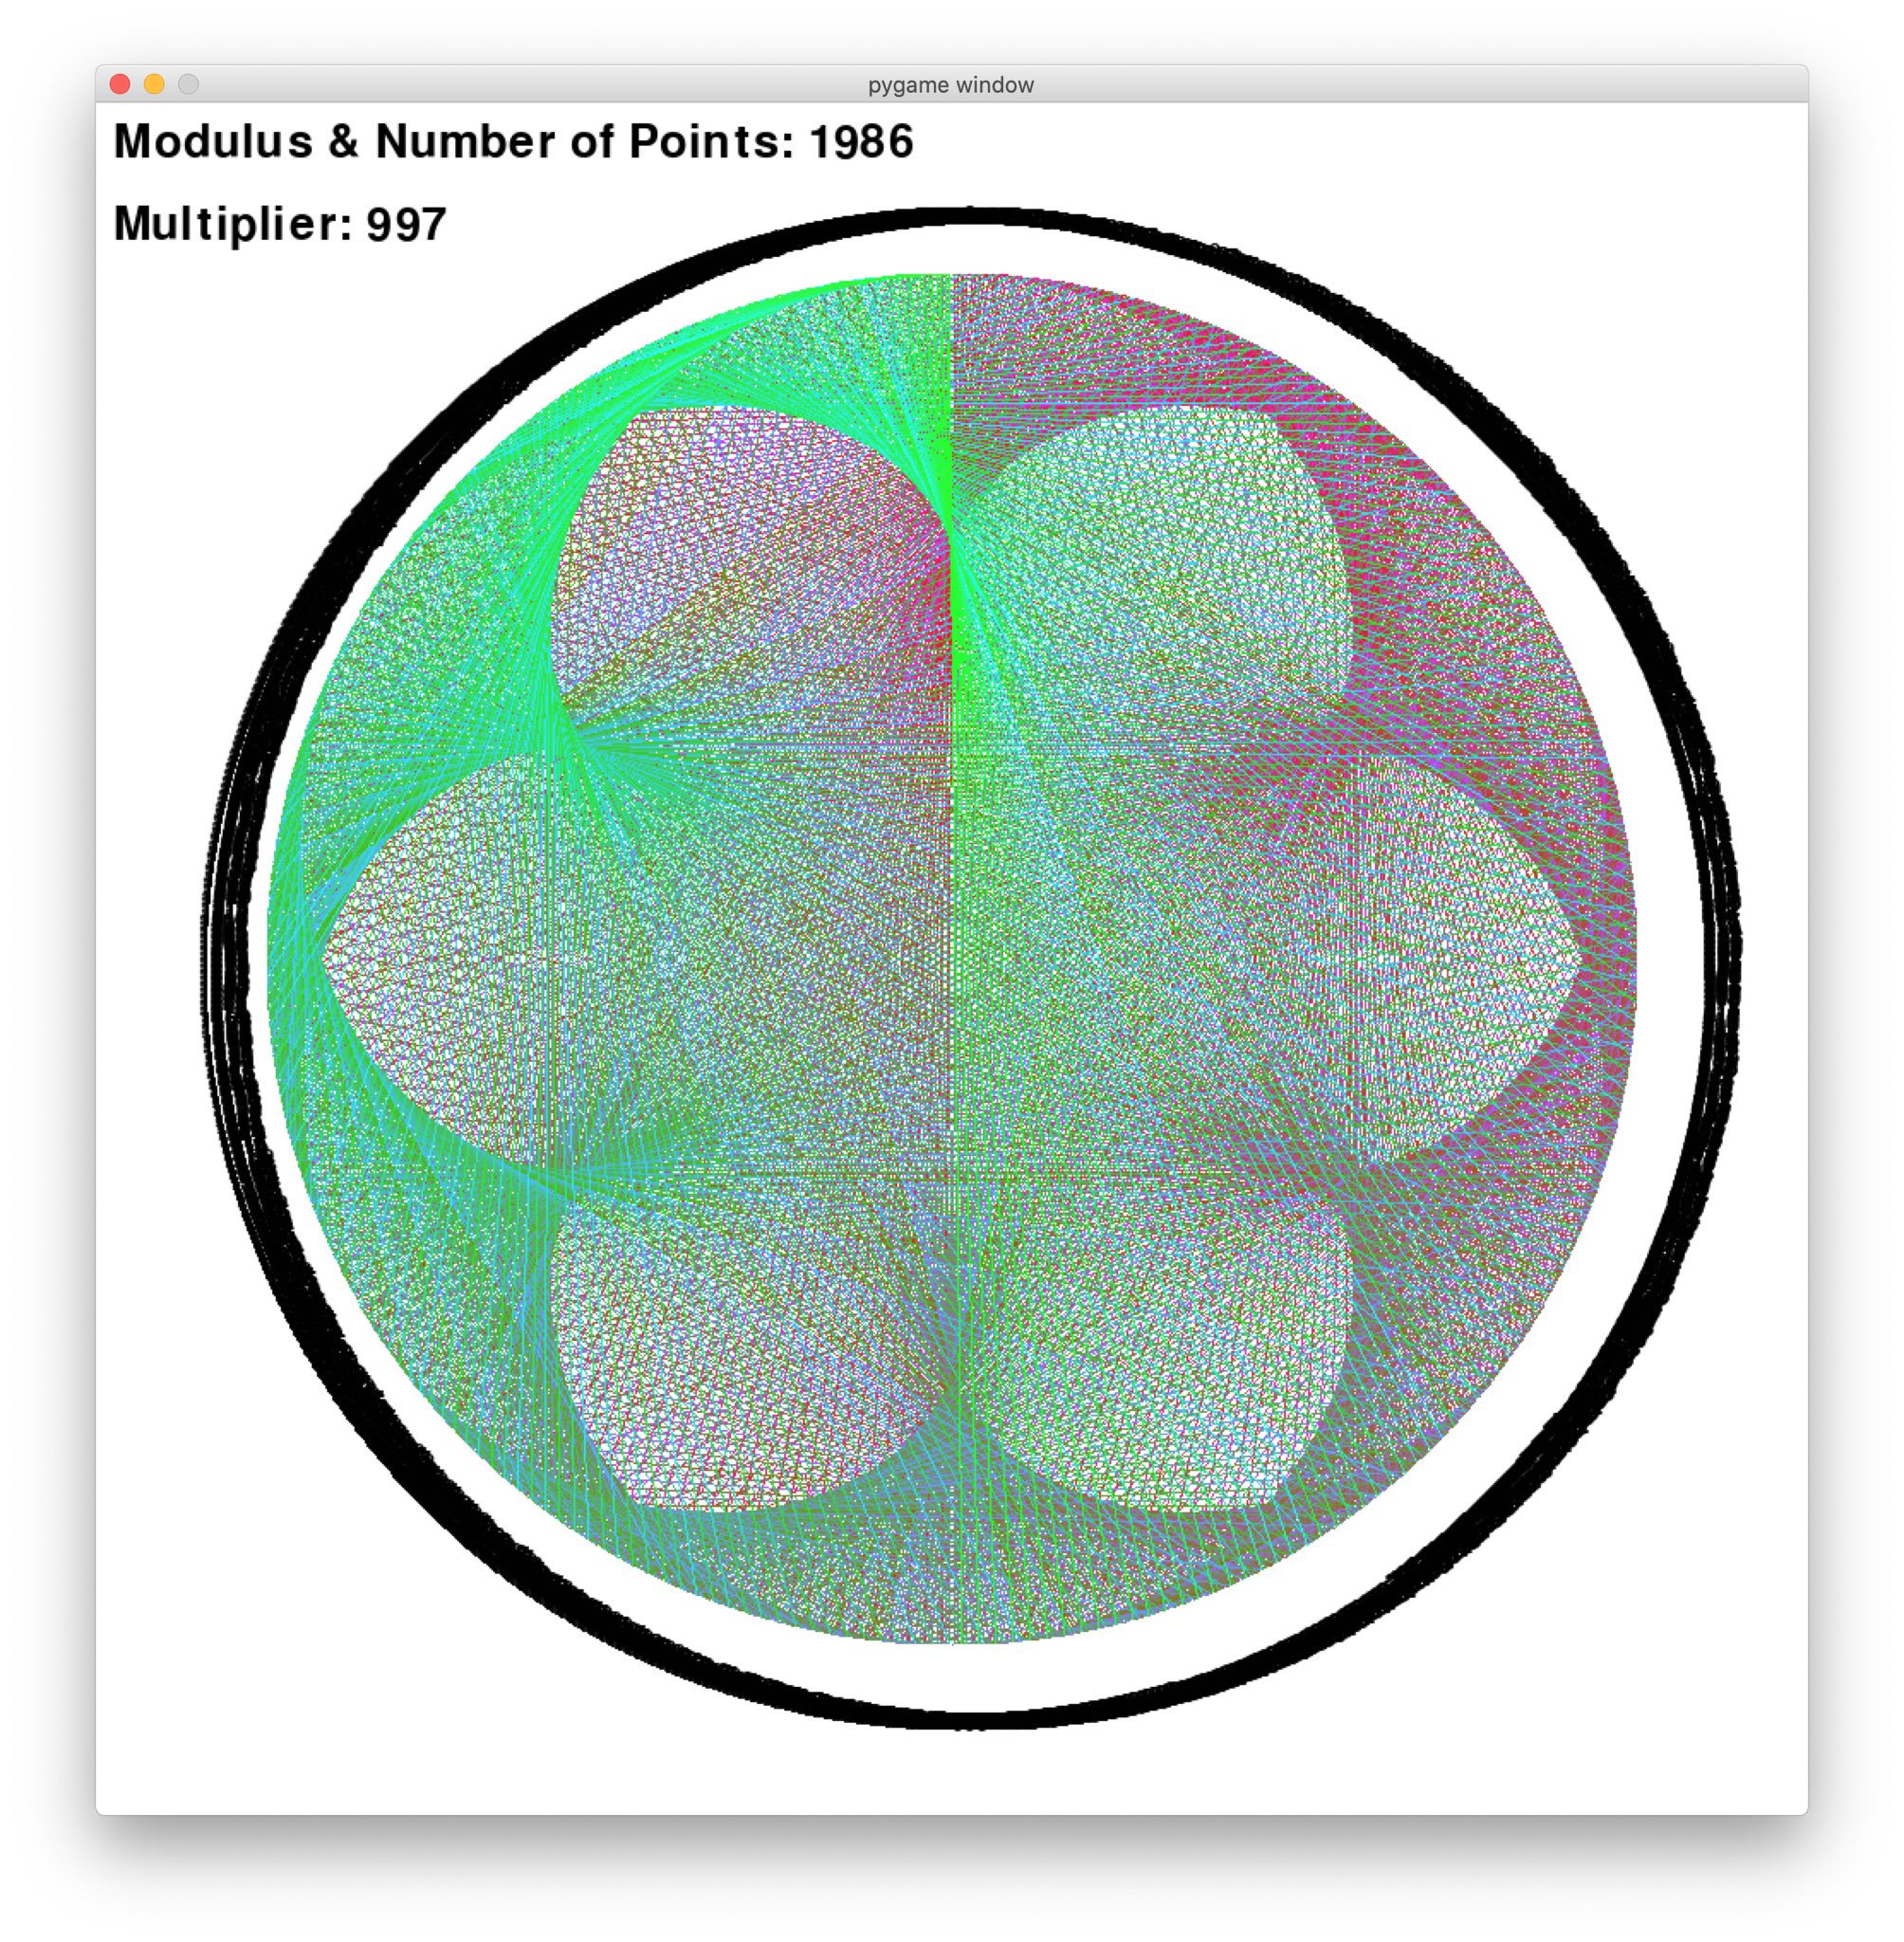
I created a prototype with pygame with 1986 points and a multiplier of 997. I've since forgotten how exactly I picked the colors, but it looks like red and green show prominently, so perhaps I fixed blue while moving from red to green clockwise around the circle.
Now we'll go over how to do this with pycairo.
Setup
I tried using pipenv with PyCharm for this project, but you can use any up-to-date virtual environment library.
For creating multiplication circles with an arbitrary amount of points, I thought the easiest way to determine starting
and ending points for different numbers would be to rotate a vector. One way I thought of doing this was by using numpy.
I installed pycairo and numpy in my environment and opened up a file named cairo_circle.py. At the top of the file,
I made my standard imports:
File: cairo_circle.py
import cairo
import numpy as np
Starting with PyCairo
I went through the pycairo introduction and quickly learned that all of the drawing is done with contexts. A context
is created from a surface, and we can use the context object's methods to move around a point and then draw lines or shapes.
To get started and draw a line, I used this code:
File: cairo_circle.py
size = (500,) * 2

with cairo.ImageSurface(cairo.Format.ARGB32, *size) as surface:
    context = cairo.Context(surface)

    context.set_source_rgb(1, 1, 1)
    context.set_line_width(1)
    context.move_to(0, 0)

    context.line_to(250, 250)
    context.stroke()

    surface.write_to_png('circle_1.png')
Let's go over this code before showing the final result:
Every surface has to have a size specified. Here I choose a size of 500x500 so that the image won't look too grainy and won't be too large of an image
The format I chose will create an image with an alpha channel, so any part of the image that isn't drawn over with lines will be transparent, so the circle we create can be laid on top of other images.
Next, we create a context object using by instantiating the cairo.Context class with our surface.
Then we set the drawing color to be white; the arguments have to be floats between 0 and 1.
If you have colors with values 0-255, just divide by 255 to get the corresponding float value.
We set the line width to be 1, and then move to the top-left corner of the screen.
pycairo's origin is in the top-left, and the x- and y- values increase to the right and down.
Then we draw a line to the middle of the screen and call context.stroke().
Finally, to see the result of our efforts, we save the ImageSurface to circle_1.png, which gives us:
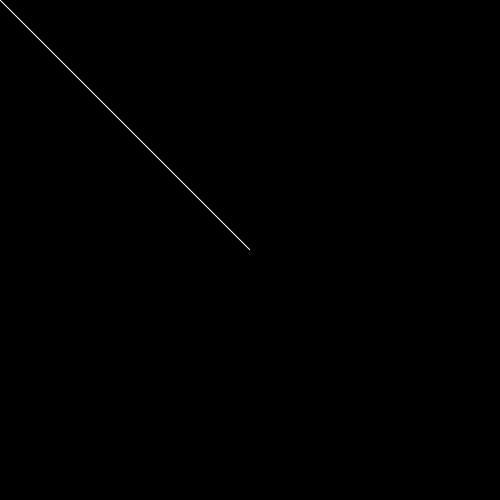
NOTE: I used the RGB24 format here instead of ARGB32, so that the colors show properly.
Great! These are all the tools we need to work with Pycairo.
Calculating Coordinates of Points
Now, given a point around the circle, we want to be able to find the coordinates for that point. To do this, we can find the angle of the point around the circle, rotate a vector by that angle, and then move the base of the vector to the center of the Cairo context. The vector then gives us the coordinates.
If we have a variable \(mod\) and a number \(num\), we can find the angle to the point
representing that number by calculating angle = ((2.0 * np.pi) / mod) * num.
One full rotation around the circle is equivalent
to \(2pi\) radians, so we divide by \(mod\) to get the correct angle
partitions for our circle. Then we multiply by \(num\) to get to the
\(num\) point.
The top of the circle has \(num = 0\), so the angle will be 0. So we need a vector
that will straight upwards. We can define this
vector as start_vec = np.array([0, -240]). We use a negative
y-value so that the vector will point upwards. Remember
that Cairo's coordinate system has the origin
in the top-left and x- and y-values increase
to the right and down.
Now we need to rotate this starting vector by our angle. According to the Rotation matrix article on Wikipedia, the matrix
multiplied by our starting vector will give us the desired vector.
So in our code, we can create the matrix using:
m = np.array([[np.cos(angle), -np.sin(angle)], [np.sin(angle), np.cos(angle)]])
and then we can obtain our desired vector by
multiplying this matrix by the starting vector:
rot_vec = np.matmul(m, start_vec).
The center of our Cairo context is (250, 250). We can calculate this value
from the size: center = (size[0] // 2,) * 2. Then, we get the
final vector using vec = rot_vec + center.
Let's put this all into a function called get_coords_for_num:
mod = 100
center = (size[0] // 2,) * 2
start_vec = np.array([0, -(center[0] - 10)])


def get_coords_for_num(num):
    angle = ((2.0 * np.pi) / (mod)) * num
    sin = np.sin(angle)
    cos = np.cos(angle)
    m = np.array([[cos, -sin], [sin, cos]])
    vec = np.matmul(m, start_vec)

    return vec + center
The center and start_vec values were calculated so that the size
of the image can easily be changed and everything will still work.
Drawing the Circle
Now that we know how to draw lines and how to get the coordinates for points around our circle, let's bring the two parts together.
For each non-negative integer \(num\) less than \(mod\), we want to
multiply \(num\) by \(mult\), and calculate the remainder
when we divide this product by \(mod\). This is more
commonly known as the modulo operation, and we can
find the remainder using: rem = (num * mult) % mod.
This is what the code looks like after adding these changes:
mult = 5

with cairo.ImageSurface(cairo.Format.ARGB32, *size) as surface:
    context = cairo.Context(surface)
    context.set_line_width(1)

    for num in range(0, mod):
        context.set_source_rgb(1, 1, 1)

        rem = (num * mult) % mod

        start_coords = get_coords_for_num(num)
        context.move_to(start_coords[0], start_coords[1])

        end_coords = get_coords_for_num(rem)
        context.line_to(end_coords[0], end_coords[1])
        context.stroke()

    circ_str = f'mod_{mod}_mult_{mult}'
    surface.write_to_png(f'complete_circle_{circ_str}.png')
We use the get_coords_for_num function to get coordinates for points
and then the Cairo drawing functions to connect a start and end point
on the circle, for all points on the circle.
Then we set the name of the circle to be something descriptive;
in this case the generated image name will be
'complete_circle_mod_100_mult_5.png'.
Here's the full code:
import cairo
import numpy as np

mod = 100
mult = 5

size = (500,) * 2
center = (size[0] // 2,) * 2
start_vec = np.array([0, -(center[0] - 10)])


def get_coords_for_num(num):
    angle = ((2.0 * np.pi) / (mod)) * num
    sin = np.sin(angle)
    cos = np.cos(angle)
    m = np.array([[cos, -sin], [sin, cos]])
    vec = np.matmul(m, start_vec)

    return vec + center


with cairo.ImageSurface(cairo.Format.ARGB32, *size) as surface:
    context = cairo.Context(surface)
    context.set_line_width(1)

    for num in range(0, mod):
        context.set_source_rgb(1, 1, 1)

        rem = (num * mult) % mod

        start_coords = get_coords_for_num(num)
        context.move_to(start_coords[0], start_coords[1])

        end_coords = get_coords_for_num(rem)
        context.line_to(end_coords[0], end_coords[1])
        context.stroke()

    circ_str = f'mod_{mod}_mult_{mult}'
    surface.write_to_png(f'complete_circle_{circ_str}.png')
which I used to generate:
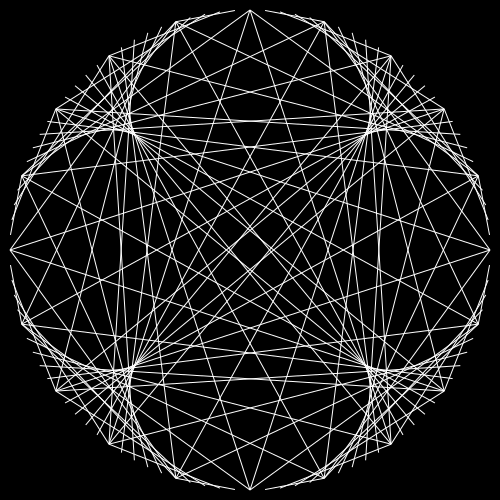
NOTE: I used the RGB24 format here instead of ARGB32, so that the colors show properly.
You can vary the mod, mult, and colors to get some cooler-looking circles.
Here are some other circles I've created:
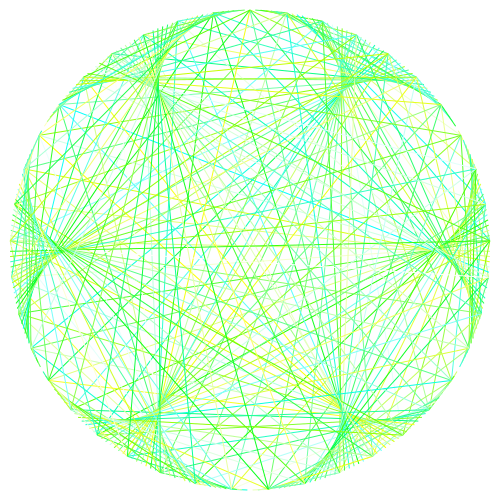
mod = 287, mult = 7, Fixed green to 1 and randomized red and blue values:
mod = 12, mult = 4, Fixed blue to 1 and randomized red and green values:
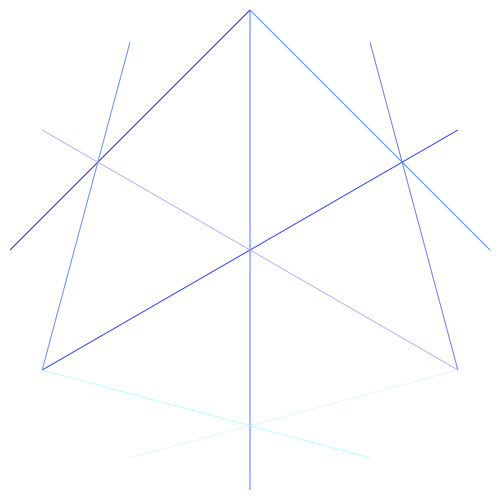
mod = 200, mult = 45, Fixed green to 1 and randomized red and blue values:
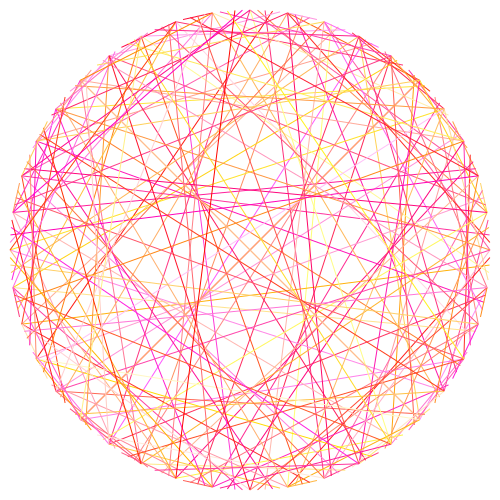
Next Steps
If you use any of the code here and make your own visual, tag me on Twitter @yashaslokesh_ so I can see it!
There will be a follow-up article to this one where I go over
how to create a video showing the circle being generated. That
article will use ffmpeg and write intermediate
images to the ffmpeg process.
Check back in a few weeks, for that article.
Conclusion
Thanks for reading, and I hope you learned more about pycairo, numpy, and modular arithmetic, if you were inexperienced in any of these topics before.
If you see any errors or suggestions for this article, feel free to file an issue on the GitHub repo or contact me on Twitter. If you want to contact me about anything else, feel free to contact me on Twitter.